Two snap decisions:
#1: Your phone rings. “Hello, this is Willy Loman from xyzTV, how are you today?” Is this caller really someone from a TV station, or is it another salesman’s ploy to get round the PA? And isn’t the name a bit familiar?
#2: Your sales manager reports. “Orders are down this month. We need to incentivise and train our sales force better”.
Would this really boost revenues as lockdowns ease? Or would it be better to restore margins by shrinking the sales organisation?
With more and more customer contacts done remotely, and purchases done via the web, will that eliminate both relationship and technical selling, and thus these two common dilemmas? The likes of eBay and Amazon serve billions of consumers without the personal touch. Comparison sites offer reams of technical details and satisfaction ratings. Nevertheless, the sales calls keep coming and the sales organisation is still, in most companies, responsible for the top line.
We can theorise as much as we like about these trends, but what managers really need is some evidence. What is a reasonable amount of resource to devote to the sales organisation? What are the likely profit and growth consequences of spending more or less? What should the mix be between national accounts teams, field sales, telesales, social media, merchandising support, category/ product management, and back office? How should the people in the sales organisation spend their time? This document shows some evidence relevant to the first two questions from the experiences of over 12’000 real businesses in the PIMS database. We also have more detailed databases to address the other questions, but they are beyond the scope of this document.
Sales organisation: good cost or bad cost?
When we look at the impact of salesforce spend across a wide range of businesses we see a clear pattern (Figure 1). We split the database by bands of sales organisation spend as a % of sales and show average Return on Investment (ROI %), Return on Sales (ROS %), and 4-year real sales growth at constant prices (%pa), for each band.
At the very low end are some businesses which structurally require virtually no sales organisation (spend less than 0.5 % of sales revenue). Examples include businesses producing commodities, hospitals, retailers, as well as pure e-commerce. They earn typically decent margins but with generally not much growth. To the right of them we see a profit curve going up and then down again. It appears that underfunding the sales organization can damage margins as well as overfunding. Up to a certain point sales organization spend is a “good cost” with a positive effect. At the high end this turns into a trade-off: large sales organizations generate more growth but at the expense of profits.
This curve is of course an average of thousands of businesses, which is why the optimum appears to be so flat – the optimum for each individual business will be much sharper and depend on its market circumstances and competitive strength. This optimum can be found by restricting the sample to “look-alikes” matching this business on the key factors.
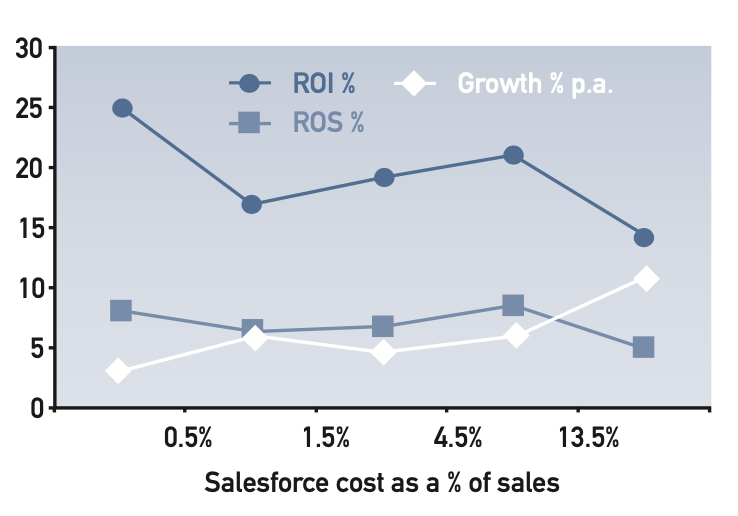
Figure 1: Performance at different levels of sales organisation spend
The interesting question is then – under what circumstances does this pattern change? Are there situations when either:
- sales organisations is always a “bad cost”, i.e. the evidence suggests it should always be minimised, or
- high sales organisations spend does not generate trade-off between profitability and growth?
The answers will help us understand where and when e-commerce will indeed “kill the salesman”, and where it will not. The next several figures show how the pattern changes for different situations, firstly relating to the business‘s customers and transactions, then to other factors.
Customers and transactions
There are nine important differences, displayed in figures 2 to 10, in customer and transaction characteristics that change the response pattern:
- the money amounts of typical immediate customer purchases
- different purchase frequencies
- different numbers of end customers
- different relative breadths of customer types served (versus competitors)
- the importance of auxiliary services
- the use of professional advisers in the purchase decision
- the stage of the business life-cycle
- the number of competitors, and
- the market share of the business
In each figure, the left hand chart shows the ROI response and the right hand chart the growth response to different levels of sales organisation spend (as a % of sales), on a somewhat more compressed scale than figure 1. Each figure splits the response curve according to different levels of each customer/ transaction characteristic, and we highlight the odd man out.
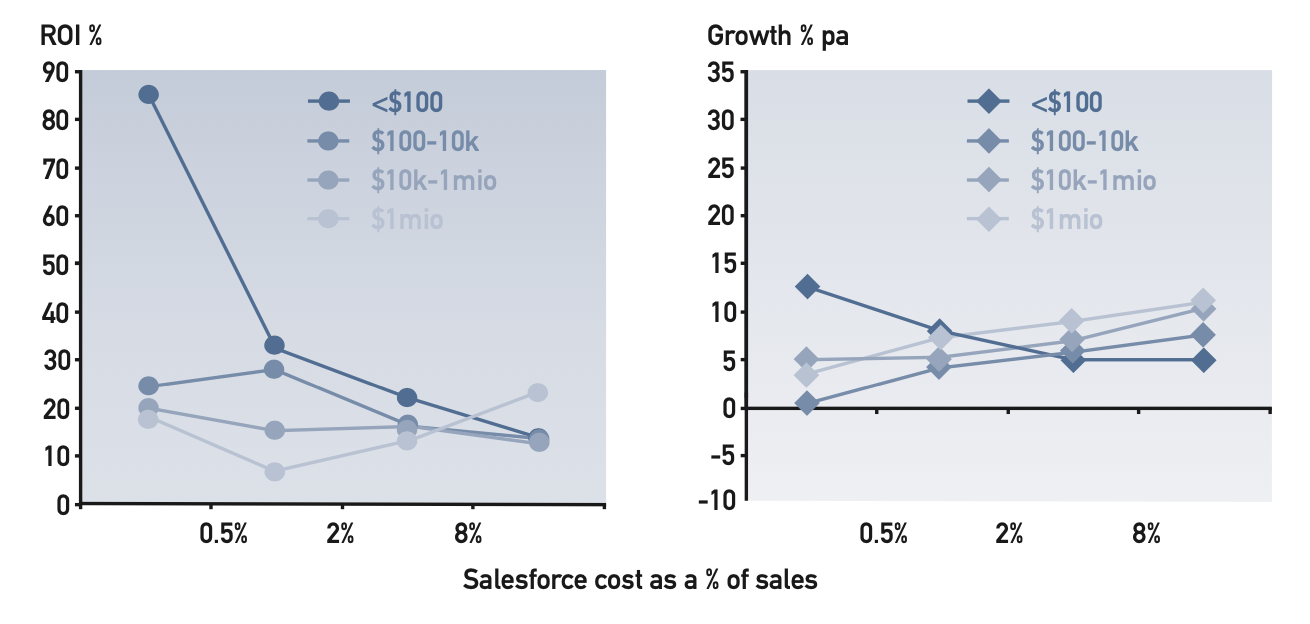
Figure 2: ROI and growth versus sales organization cost (% of sales) for different levels of typical immediate customer purchase amount
We have highlighted the lines for purchase amount less than $100, which behave completely differently. For small ticket items, sales organization is a “bad cost” both for profitability and for growth: it would appear such markets are ideal for internet transactions. On the other hand for very large purchase amounts high sales organisation cost boosts both ROI and growth: customers committing large money amounts need a face to trust.
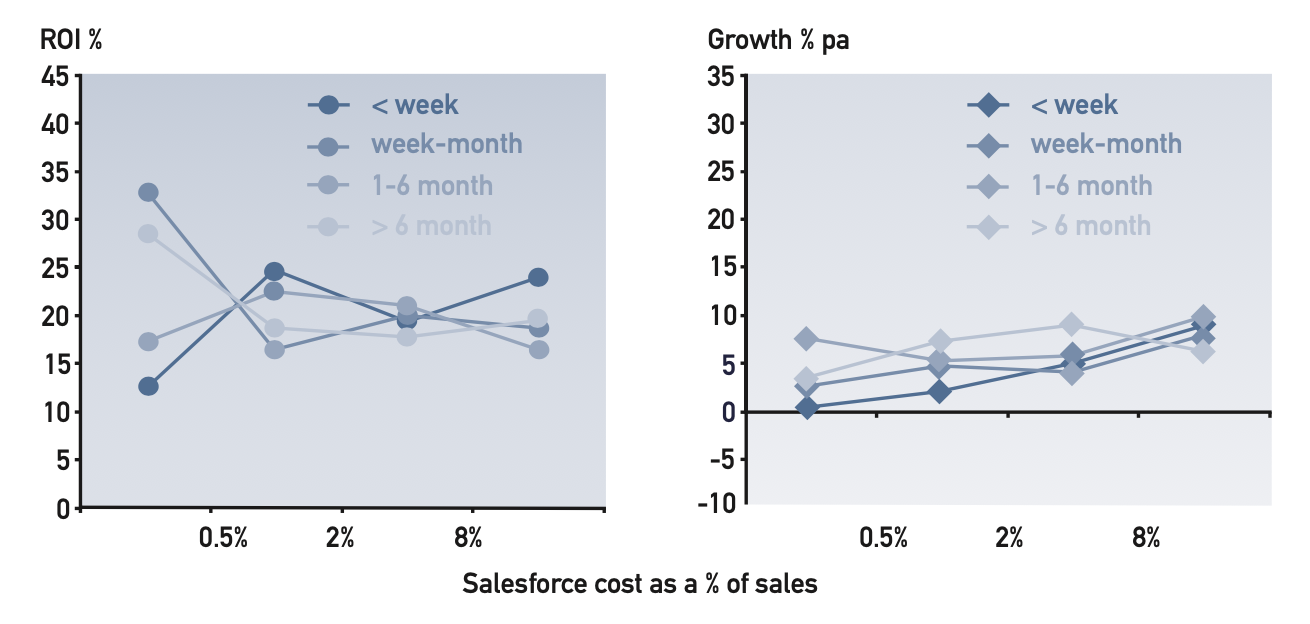
Figure 3: ROI and growth versus sales organisation cost (% of sales) for different levels of typical immediate customer purchase frequency
We have highlighted the lines for goods purchased very frequently (weekly or more often) – here sales organisation is again a “good cost” for both ROI and growth. This is a different case from the high purchase amount: for very frequent purchases the customer doesn‘t want the agony of decision every time and “outsources” the decision to the expert, his supplier‘s sales person, who knows the customer‘s needs in detail. For less frequent purchases there is the usual trade-off between ROI and growth.
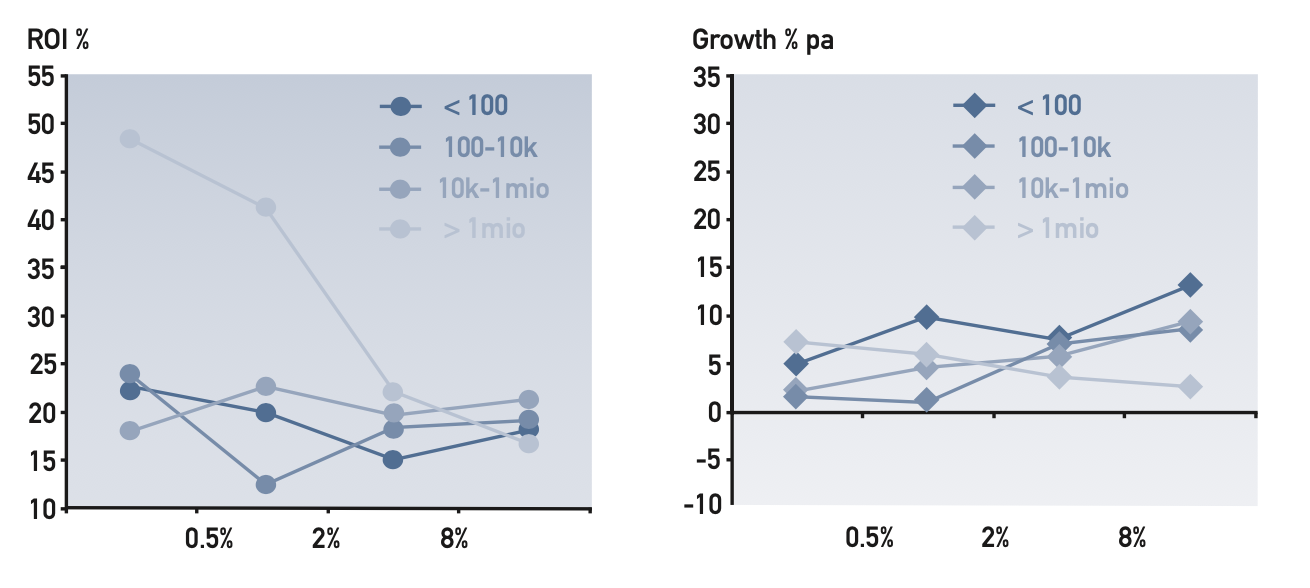
Figure 4: ROI and growth versus sales organization cost (% of sales) for different numbers of end customers
We have highlighted the lines for mass consumer goods with over a million end customers – here sales organisation is generally a “bad cost” for both ROI and growth. Of course there are exogenous factors that drive both low ROI and high sales costs: for instance having to deal with a large number of “impulse” outlets. But if the internet can be harnessed to reduce sales costs, it is likely to pay off. For less mass markets there is the usual ROI/ growth trade-off.
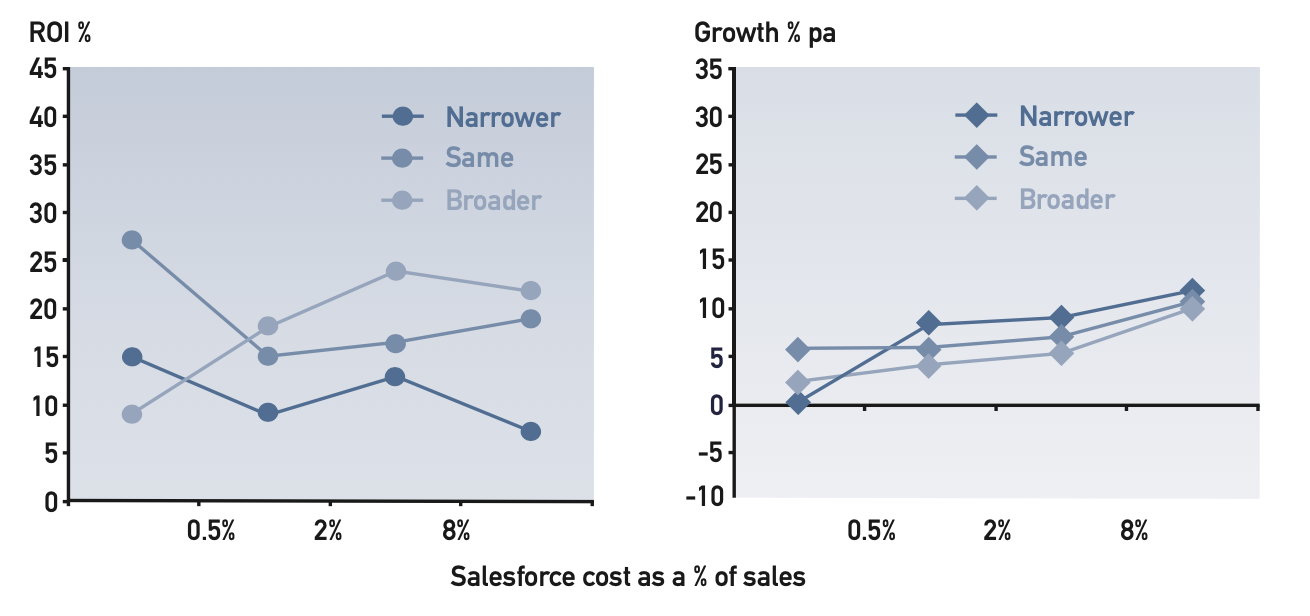
Figure 5: ROI and growth versus sales organisation cost (% of sales) for different relative breadth of customer types served (vs. competitors)
We have highlighted the lines for businesses with a broader range of customer types than competitors, where sales organisation spend is generally beneficial. This may be related to the broader flow of market information available via the sales organization.
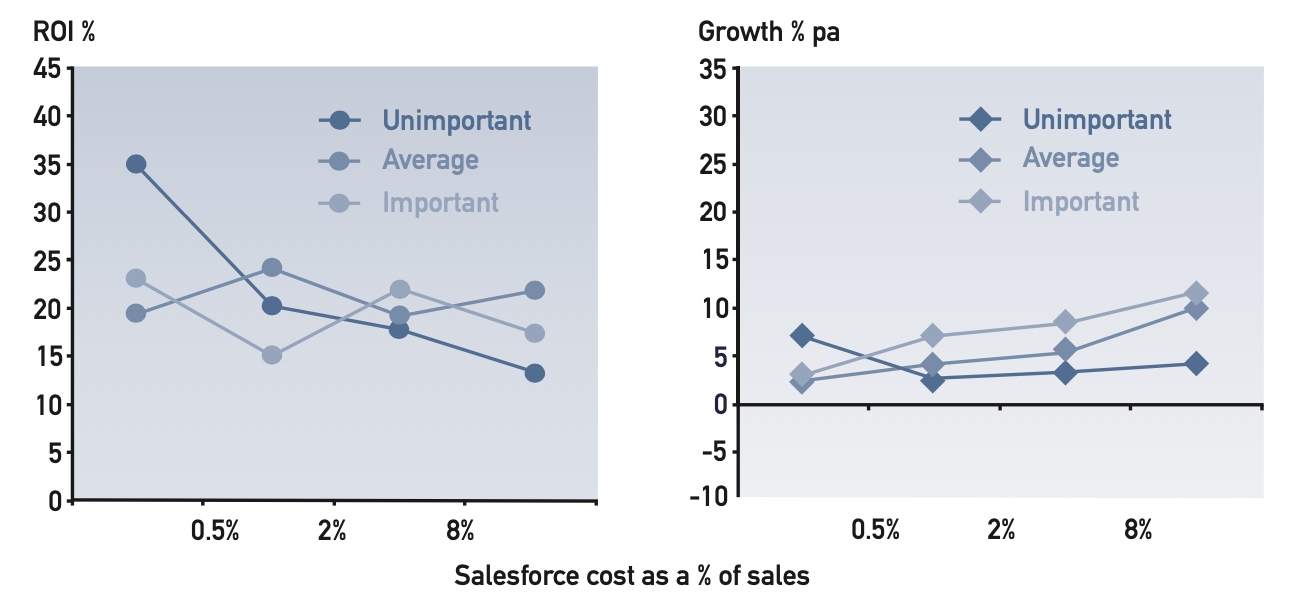
Figure 6: ROI and growth versus sales organisation cost (% of sales) for different levels of importance of auxiliary services (e.g. after-sales service, warranties etc.)
We have highlighted the lines for businesses in which auxiliary services are unimportant, where sales organisation is generally a “bad cost”, and e-commerce can be a viable option.
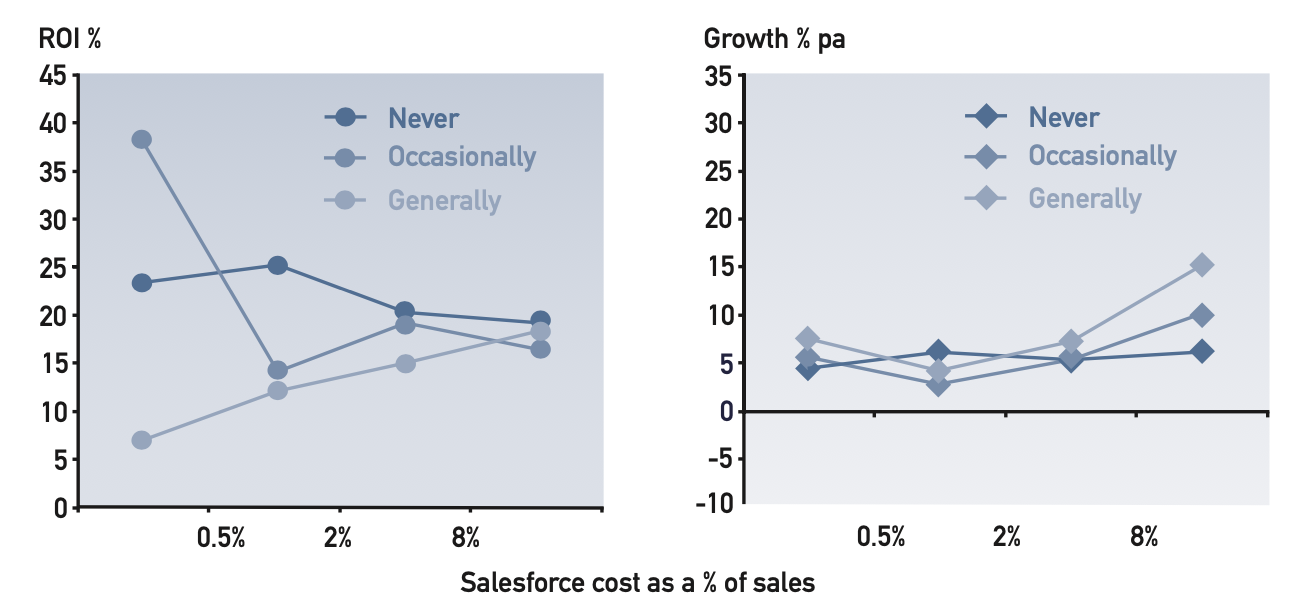
Figure 7: ROI and growth versus sales organisation cost (%of sales) for different levels of use of professional advisor (e.g. doctor, architect etc.) in the purchase decision.
We have highlighted the lines for businesses where such experts are generally consulted, where sales organisation seems to be an essential requirement for good performance, on account of the need to build positive relationships with the advisor community.
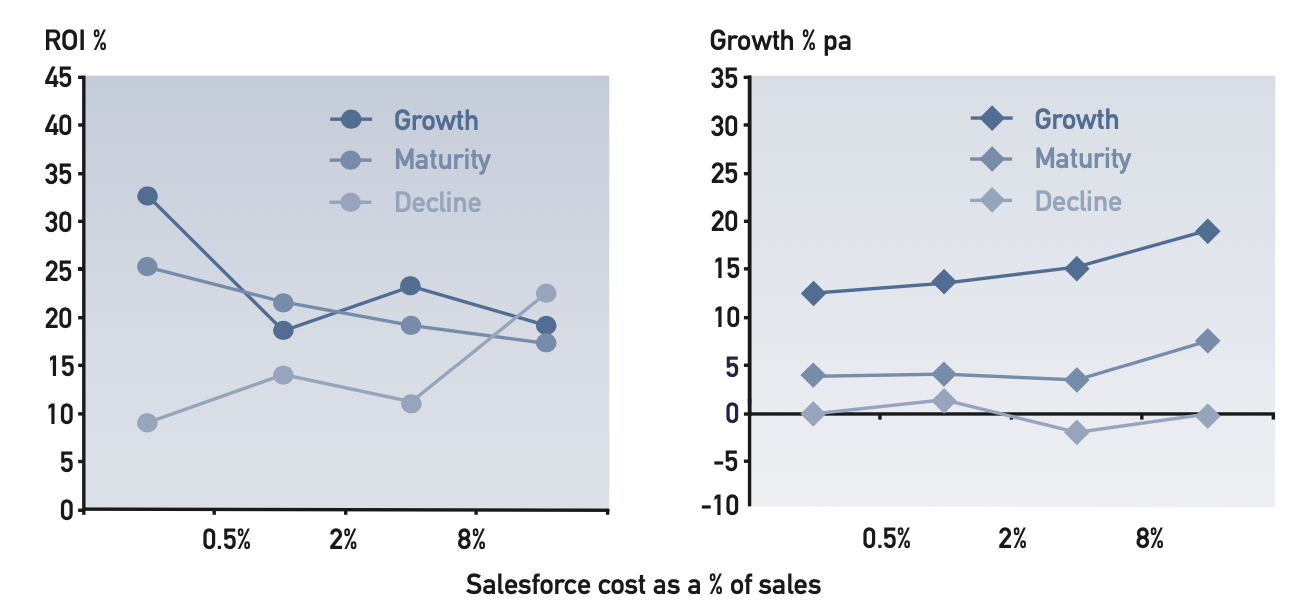
Figure 8: ROI and growth versus sales organisation cost (% of sales) for different stages of the business lifecycle.
We have highlighted the lines for the decline stage of the life-cycle, where sales efforts are required to maintain profitability (but, a bit surprisingly, without helping growth). Our hypothesis is that a sales organisation selling model allows you to focus on the more attractive customers; with the internet you cannot so easily discriminate between customers. Neither can you sense which customers are themselves in decline and likely to be increasingly price sensitive and poor credit risks.
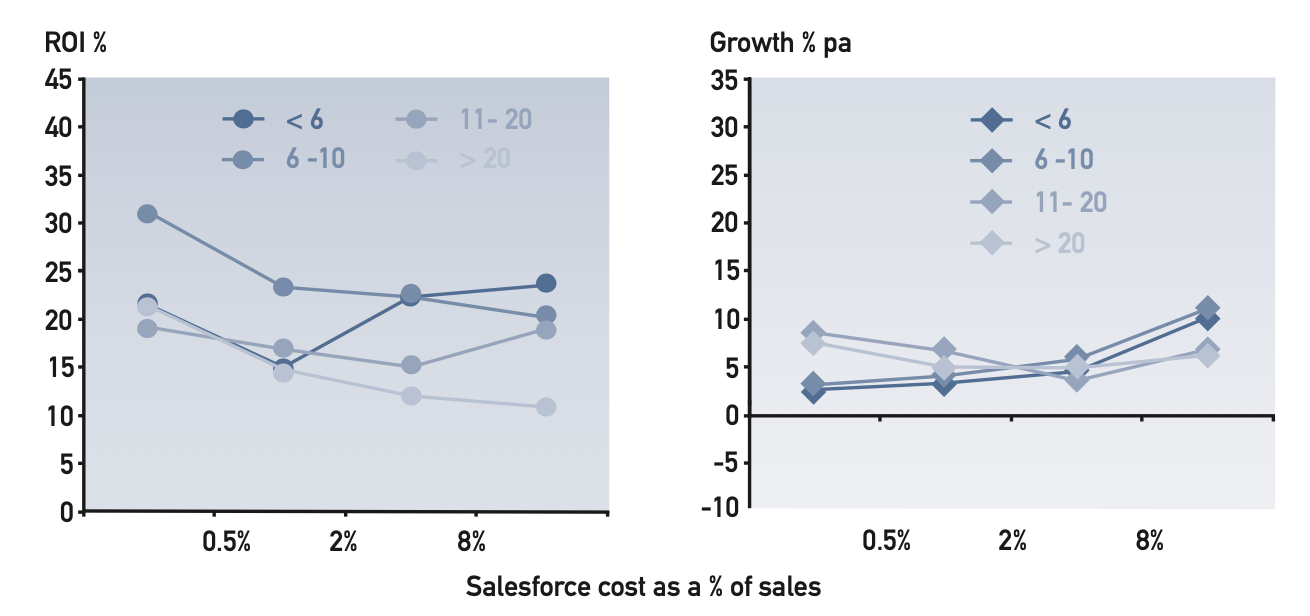
Figure 9: ROI and growth versus sales organisation cost (% of sales) for different numbers of significant competitors
We have highlighted the lines for less than six significant competitors, where sales organisation is a good cost. When the customer is faced by fewer choices, a nuanced sales call addressing his particular needs may effectively tip the balance.
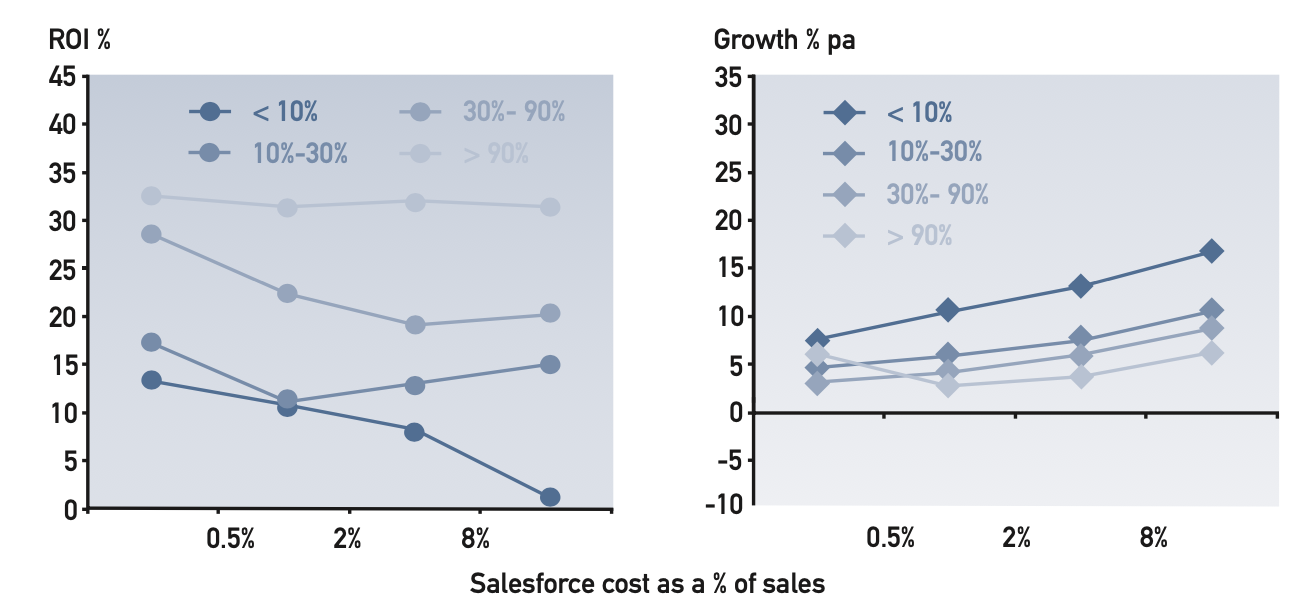
Figure 10: ROI and growth versus sales organisation cost (% of sales) for different levels of relative market share (this business as a % of three major competitors combined)
We have highlighted the lines for weak share businesses, where the trade-off between profitability and growth along the sales organisation dimension is particularly strong. Market leaders are of course generally more profitable but have less headroom for growth, and can in general afford to be less concerned about optimising sales organization levels.
Conclusion
So, do e-commerce and home working presage the death of the salesman in the post-Covid-19 world? Possibly yes, if your business is:
- selling in small lots
- to a fragmented customer and channel base
- not reliant on professional advisors
- against fragmented competition
- in a growth market
- to a narrower range of customer types
- with a strong share
- not based on superior service.
But no, if the situation is reversed. There is still a need for relationship and technical selling where customers need service and support in how to use the product, and where different customers need different treatment. Weaker share competitors in concentrated markets can grow by targeting strong sales effort on customers who value a product/ service package tailored to their needs.
Notes
- Return On Investment (ROI) and Return On Sales (ROS) are measured pre-tax and prior to finance charges. Investment is fixed assets at net book value plus working capital. Growth is real sales growth per annum at constant prices.
- Immediate customers and end customers. An immediate customer is someone you invoice for the product. An end customer is someone who consumes it or incorporates it in a wider offer – they may be the same as the immediate customer, or the last link in a distribution chain where the immediate customer is the first link. If you sell carrots to restaurants, the restaurant is the end customer because he incorporates them into a meal for his customer. If you sell wine, the diner is the end customer because he chooses which wine (if any) to buy from a list of alternatives with different prices.
- Businesses are arranged in charts at equal additive or multiplicative intervals to illustrate the range of the PIMS database. There are not equal numbers of businesses in each group.
- Sales organisation spend covers field sales, merchandising, national accounts teams, category/product management, customer call centres and relevant IT support, but not customer technical service. Outsourced services in these areas are included.
- Research confirms the commonsense view that sales organization spend drives performance with a time lag – typically two years. In this document we measure the drivers as the average of years 1 and 2 of a 4-year observation, the profit consequences as the average of years 3 and 4, and growth rates as the average over all 4 years.
- The PIMS database currently contains the strategy experiences, good and bad, of over 12’000 product and service businesses provided by participating companies. Each experience is documented in terms of the actions taken by the business, the nature of its served market, the kind of competitive environment, and its financial results. In all, 500 distinct characteristics of each business experience are available for study. The evidence shows that cross-industry modelling provides more appropriate benchmarks than taking “best in industry” – which can be disastrous for weaker competitors if they then attempt to take on the leader on the battleground where the leader is strongest.
- Willy Loman is the central character in Arthur Miller‘s theatrical masterpiece, “Death of a Salesman”.